What's the Difference between Nanobubbles and Microbubbles - and Why It Matters
A definitive technical guide to bubble size physics, stability mechanisms, and the real-world performance implications that separate these two technologies across every major application.
Key Takeaways
- Nanobubbles (<1 µm) and microbubbles (1–1,000 µm) occupy entirely different physical regimes with fundamentally different behavior.
- Nanobubbles defy buoyancy, remaining suspended in solution for days to weeks; microbubbles rise and dissipate within seconds to minutes.
- The ultra-high surface area and neutral buoyancy of nanobubbles generate dissolved gas concentrations and mass-transfer efficiencies unattainable by any conventional aeration or microbubble system.
- Understanding which bubble technology is appropriate for a given application determines both capital efficiency and process outcomes — they are not interchangeable.
- TMC Nanobubble Generators produce certified sub-micron bubbles validated by Nanoparticle Tracking Analysis (NTA).
Setting the Scale: A Matter of Orders of Magnitude
The word "bubble" suggests a simple, unified concept - a pocket of gas surrounded by liquid. But across the range of scales at which bubbles can exist, the governing physics changes so dramatically that calling a nanobubble and a conventional air bubble by the same name is a bit like calling an atom and a marble the same object. Both are spheres. Beyond that, almost nothing is the same.
To understand why bubble size matters, we first need to establish the size regimes and how they relate to everyday physical references.
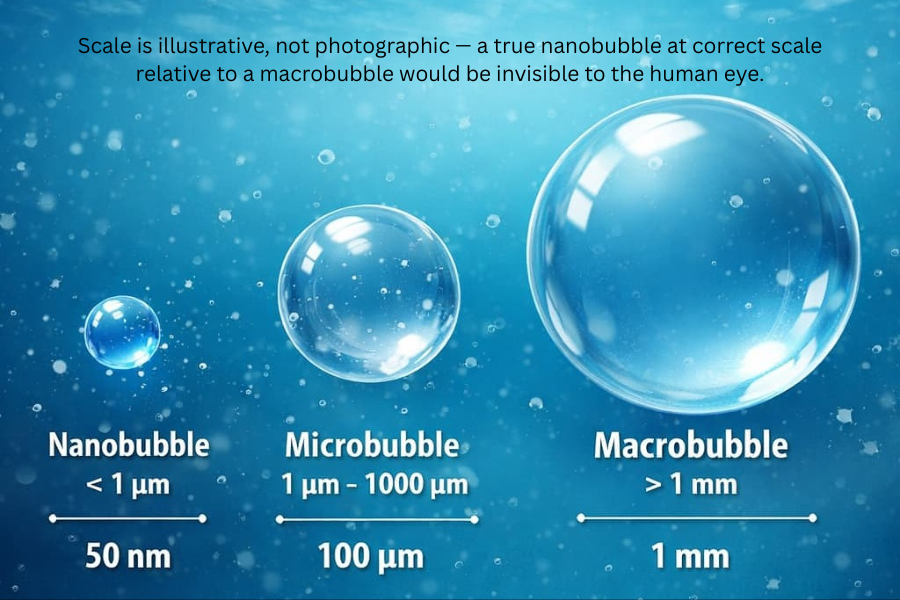
A human red blood cell is approximately 6–8 µm in diameter. A nanobubble at 200 nm is roughly 30–40× smaller than a red blood cell. A typical microbubble at 50 µm is about 7 red blood cells across. A coarse-diffuser macrobubble visible to the naked eye may be 2–5 mm — approximately 300 red blood cells wide. Each jump represents not just a change in size but a crossing of physical thresholds that fundamentally alter how the bubble behaves in solution.
The critical threshold is approximately 1 µm (1,000 nm). Below this diameter, bubbles transition into a regime dominated by Laplace pressure, Brownian motion, and surface charge effects — and buoyancy ceases to be the dominant force. This is the nanobubble domain, and it operates by a different set of rules than anything produced by conventional aeration or microbubble generation equipment.
The Physics of Stability: Why Nanobubbles Refuse to Rise
The most counterintuitive property of nanobubbles — and the one with the greatest practical consequences — is their stability in solution. A macrobubble released at the bottom of a tank rises to the surface and bursts in a fraction of a second. A microbubble may linger for seconds to minutes depending on its size. A true nanobubble can remain suspended in solution for hours, days, or even weeks without coalescing or rising.
Several physical mechanisms work in concert to produce this remarkable stability:
Laplace Pressure
The internal pressure of a bubble is governed by the Young-Laplace equation: the pressure differential across a curved interface is proportional to surface tension divided by radius. As bubble diameter shrinks, internal pressure rises dramatically. At nanoscale diameters, this pressure is so extreme that it creates a thermodynamic environment that suppresses dissolution. The high internal pressure compresses the gas phase, reducing the effective concentration gradient driving dissolution into the surrounding liquid and counteracting the expectation that such a tiny bubble should dissolve almost instantaneously.
Surface Charge (Zeta Potential)
Nanobubbles in aqueous solution accumulate a significant negative surface charge, with zeta potential values typically measured in the range of −20 mV to −40 mV or more. This electrostatic charge creates a repulsive barrier between neighboring nanobubbles, preventing coalescence — the mechanism by which small bubbles would otherwise combine into larger ones and rise. The origin of this surface charge is still an active area of research, but it is experimentally well-established and consistently reproduced. It is one of the defining signatures used to verify the presence of genuine nanobubbles in solution.
Brownian Motion Dominates Buoyancy
At sub-micron scales, the random thermal motion imparted by collisions with surrounding water molecules — Brownian motion — becomes far more significant than the gravitational buoyancy force acting on the bubble's small mass. The Stokes velocity for a 200 nm bubble in water is on the order of nanometers per second; the bubble will diffuse laterally and vertically through thermal agitation thousands of times faster than it could ever rise by buoyancy. The practical result: nanobubbles remain uniformly distributed throughout the liquid volume without mechanical agitation. This is not possible for any microbubble or larger bubble.
"The nanobubble's stability is not a curiosity — it is the mechanism that underpins every one of its performance advantages. A bubble that stays in the water works continuously; a bubble that rises and escapes works only once."
Why Microbubbles Are Different
Microbubbles operate in a transitional regime. At the upper end of the microbubble range (hundreds of microns), behavior closely resembles macrobubbles: buoyancy dominates, rise velocities are measurable, and residence time in solution is short. At the lower end (1–10 µm), microbubbles rise slowly and can transfer significant gas before reaching the surface, which is why microbubble technology (fine-bubble diffusers, membrane aerators) improved on coarse-bubble diffusion. But even the smallest microbubbles eventually rise, and none of them develop the electrostatic stability or Laplace-pressure suppression of the nanobubble.
The fundamental distinction: microbubbles are transient — they deliver gas as they rise and then are gone. Nanobubbles are persistent — they remain in solution as a reservoir of dissolved and nano-encapsulated gas, continuing to interact with the liquid and any solutes, organisms, or surfaces present.
Key Physical Properties: A Direct Comparison
The table below summarizes the most important engineering-relevant physical properties across the three bubble size regimes. These differences are not incremental — they represent categorical changes in behavior that dictate how, and whether, a given bubble technology is fit for a given application.
Nanobubbles vs. Microbubbles vs. Macrobubbles - Key Differences
| Property | Nanobubble (< 1 µm) |
Microbubble (1 µm to 1,000 µm) |
Macrobubble (> 1-mm) |
| Diamete Range | 50 nm – <1,000 nm | 1 µm – 1,000 µm | 1 mm – 10+ mm |
| Buoyancy Behavior | Negligible — Brownian motion dominates |
Slow to moderate rise | Rapid rise; short contact time |
| Residence Time in Water | Hours to weeks | Seconds to minutes | Milliseconds to seconds |
| Specific Surface Area | Extremely high (>20,000 m²/m³ dissolved gas) |
Moderate | Low |
| Internal Pressure | Very high (Laplace); suppresses dissolution |
Moderately elevated | Near ambient |
| Surface Charge (Zeta Potential) |
Strongly negative (−20 to −40 mV+) |
Slightly negative to neutral | Neutral / Negligible |
| Coalescence Tendency | Very low (electrostatically stabilized) |
Moderate | High |
| Mass Transfer Efficiency (O₂ or other gases) |
Very high — sustained, liquid-phase delivery |
Moderate — during rise only |
Low — minimal contact time |
| Dissolved Oxygen Elevation |
Can achieve supersaturation |
Up to saturation | Below saturation (inefficient) |
|
Free Radical Generation |
Significant under collapse conditions |
Minimal | None |
| Visibility to Naked Eye | Invisible — milky white in high concentrations |
Visible at upper range; hazy at lower |
Clearly visible |
| Detection Method | Nanoparticle Tracking Analysis (NTA), DLS |
Laser diffraction, optical imaging |
Direct optical - |
The Four Mechanisms That Drive Nanobubble Performance
Understanding why nanobubbles outperform microbubbles in most demanding applications requires examining the specific physical and chemical mechanisms at work. These four mechanisms - operating simultaneously - explain the documented performance advantages seen in field deployments across industries.
Extreme Specific Surface Area
Halving a bubble's diameter increases surface-to-volume ratio by 2×. Going from a 1 mm macrobubble to a 200 nm nanobubble increases specific surface area by roughly 5,000×. This is the primary driver of mass transfer efficiency — more interface area means more gas can dissolve into the liquid per unit time and per unit energy input.
Persistent Supersaturation
Because nanobubbles remain in solution rather than escaping as gas, they function as a sustained reservoir for dissolved oxygen (or other gases). Water treated with TMC Nanobubble Systems routinely maintains dissolved oxygen concentrations well above saturation — levels impossible to achieve or sustain with any microbubble or diffuser-based system.
Hydroxyl Radical Generation
Under certain conditions - particularly collapse events triggered by ultrasonic cavitation or chemical reaction - nanobubbles can generate hydroxyl radicals (·OH), among the most potent oxidizing agents known. This property underpins nanobubble efficacy in water disinfection, pharmaceutical sanitation, advanced oxidation processes, and pesticide degradation, where microbubbles have no equivalent mechanism.
Surface Adsorption & Wettability
The strong negative surface charge of nanobubbles makes them effective at adsorbing positively charged contaminants, heavy metal ions, and hydrophobic particles. This charge-driven adsorption, combined with the ability of nanobubble water to alter the contact angle of surfaces (improving or reducing wettability depending on the application), enables applications in mineral flotation, seed germination, membrane cleaning, and crop yield enhancement that have no parallel in microbubble technology.
Energy efficiency follows directly from these mechanisms. A conventional coarse-bubble diffuser or even a fine-bubble membrane aerator transfers gas only while the bubble is in contact with the liquid during its rise. The moment it surfaces, that energy investment is lost. Nanobubbles transfer gas continuously throughout their extended residence time — meaning the energy consumed in generating them continues to yield value long after generation has stopped. In wastewater treatment applications, this can reduce aeration energy costs by 30–50% for equivalent dissolved oxygen targets.
Application Fit: Where Each Technology Belongs
Given these fundamental differences in behavior, nanobubbles and microbubbles are not competing technologies so much as tools suited to different jobs. There are applications where microbubble technology remains appropriate — and others where only nanobubble performance can achieve the required outcome. Selecting the wrong technology at the design stage is costly; understanding the fit criteria is essential.
Where Nanobubbles Are the Clear Choice
| Aquaculture | Ultra-high dissolved oxygen and sustained supersaturation support intensive stocking densities impossible to maintain with conventional aeration. Fish survival rates, feed conversion ratios, and growth rates all improve measurably. Nanobubble water also reduces pathogenic load without chemicals. |
| Wastewater Treatment | Dramatically reduced aeration energy for biological oxygen demand (BOD) removal. Nanobubble-enhanced bioreactors support aerobic microbial metabolism with a fraction of the energy input of conventional fine-bubble diffusers. Applications include municipal WWTP, industrial effluent, and aquaculture water recirculation systems. |
| Agriculture / Irrigation | Ozone-nanobubble water has demonstrated 20% to 40% yield improvements across multiple crop types (strawberries, lettuce, tomatoes, cannabis) in peer-reviewed studies, alongside reductions in chemical fertilizer and pesticide requirements. Mechanism involves improved root-zone oxygen, enhanced nutrient uptake, and direct pathogen suppression. |
| Carbon Capture | CO₂ nanobubbles achieve dissolution rates orders of magnitude higher than macrobubble or sparger-based CO₂ injection. The stable suspension enables efficient direct air capture integration, geological sequestration enhancement, and mineral carbonation — emerging as a cornerstone technology for industrial decarbonization. |
| Water Disinfection | Ozone and hydroxyl radical generation via nanobubble collapse provides chemical-free, highly effective disinfection of potable water, process water, and ultra-pure water applications in pharmaceutical and semiconductor manufacturing. |
| Mining / Flotation | Enhanced mineral recovery through nanobubble attachment to hydrophobic mineral particles, improving selectivity and grade in froth flotation circuits. Nanobubbles also reduce the water and reagent volumes required per ton of ore processed. |
| Medical / Clinical | Wound healing, tissue oxygenation, and targeted drug delivery applications leverage the biocompatibility and oxygen-carrying capacity of nanobubble solutions. Wound irrigation with oxygenated nanobubble saline has shown accelerated healing in clinical pilots. |
Where Microbubbles Remain Relevant
Microbubble technology retains a role in applications where short-contact-time gas delivery is acceptable and cost-per-unit-flow is the primary constraint. Conventional fine-bubble membrane diffusers (which produce bubbles in the 1–3 mm range, technically macrobubbles despite being called "fine") and some advanced microbubble generators (producing true 10–200 µm bubbles) are appropriate for large-volume, low-specificity aeration: municipal activated sludge basins at very large scale, crude oil separation, some fermentation processes, and column flotation in mining.
The honest engineering answer is: if the required DO levels, contact time, or surface-adsorption functionality can only be delivered by a bubble that stays in the water, nanobubbles are not optional — they are the only viable route.
"Microbubble technology was a step forward from coarse diffusers. Nanobubble technology is a step change from microbubbles — not an incremental improvement, but a different operating regime entirely."
How to Verify You're Getting True Nanobubbles
One of the significant challenges in the nanobubble industry is the proliferation of equipment marketed as "nanobubble generators" that do not actually produce sub-micron bubbles in meaningful concentrations. This is not a trivial distinction — equipment producing bubbles primarily in the 5–50 µm range operates entirely within the microbubble regime and cannot deliver nanobubble-specific performance characteristics, regardless of how it is marketed.
Legitimate nanobubble verification requires one or more of the following analytical methods:
Nanoparticle Tracking Analysis (NTA)
NTA uses laser scattering to visualize and track individual nanoparticles (including nanobubbles) as they undergo Brownian motion. From the tracking data, hydrodynamic diameter distribution and particle concentration are calculated. NTA provides direct, particle-by-particle measurement of size distribution and is the gold standard for confirming nanobubble size and concentration. TMC Nanobubble Generators are validated by Factory Acceptance Testing (FAT) with NTA instrumentation, providing traceable data on bubble size distribution and count per milliliter.
Dynamic Light Scattering (DLS)
DLS measures the fluctuation in scattered laser intensity due to Brownian motion and derives a hydrodynamic size distribution from autocorrelation analysis. It is well-suited for concentrated, monodisperse populations and provides a rapid, reproducible check. DLS is commonly used for process monitoring where NTA is impractical.
Zeta Potential Measurement
Confirming a strongly negative zeta potential (typically more negative than −15 mV) in treated water provides supporting evidence of genuine nanobubble populations. Dissolved oxygen can be elevated by many methods; the combination of high DO and a stable negative zeta potential is a more specific indicator of nanobubble presence.
Dissolved Oxygen Supersaturation
While not definitive on its own, sustained DO levels above the theoretical saturation limit at ambient temperature and pressure — without ongoing mechanical aeration — is strong practical evidence that nanobubble-mediated oxygen reservoir effects are present. Standard fine-bubble diffuser systems cannot maintain supersaturation after aeration stops; nanobubble-treated water will.
Ask for NTA data. Ask for Zetasizer Test Results. Any equipment supplier making nanobubble claims should be able to provide size distribution histograms from NTA measurements showing median particle diameter below 300–500 nm and particle concentrations in the range of 10⁷–10⁹ particles/mL under specified operating conditions. TMC Fluid Systems provides Bureau Veritas-witnessed Factory Acceptance Test data for all TMC Nanobubble Generator installations. If a supplier cannot provide this, the equipment is not producing true nanobubbles.
Selecting the Right Technology: A Practical Framework
Technology selection for any gas-liquid application should begin with a clear-eyed assessment of what the process actually requires. The following questions provide a practical framework for determining whether nanobubble technology is warranted:
- What is the required dissolved gas concentration and how long must it be sustained? If DO targets exceed 8–10 mg/L and must persist without continuous aeration, nanobubbles are the only practical option.
- Is the application sensitive to energy costs? In applications where aeration represents a significant operating cost (wastewater, aquaculture, hydroponics), nanobubble efficiency advantages compound significantly over time. Payback periods of 18–36 months are common in correctly specified installations.
- Does the application require gas-liquid contact beyond the point of bubble generation? Nanobubble water can be piped, stored, and distributed while retaining its gas content — enabling remote-point delivery applications (drip irrigation, distributed point-of-use disinfection) impossible with any rising-bubble technology.
- Are surface chemistry or adsorption effects required? Applications involving particle separation, wettability modification, biofilm control, or contaminant adsorption will require the surface charge and specific surface area of nanobubbles. Microbubbles provide none of these properties.
- What flow rate is required, and at what capital cost ceiling? TMC Nanobubble Generators are available from lab-scale up to high-capacity industrial units, covering flow rates from bench-scale to 1,000 m³/hr. Correct sizing ensures both performance and capital efficiency.
Matching the technology to the requirement — rather than defaulting to the most familiar or lowest-capex option — is the foundation of good process engineering. In the majority of performance-critical gas-liquid applications, that analysis points clearly toward nanobubble technology.
Conclusion: Not a Better Bubble — A Different Phenomenon
The distinction between nanobubbles and microbubbles is sometimes presented as a matter of degree — as if a smaller bubble is simply a more efficient version of a larger one. This framing misrepresents the underlying science. A nanobubble does not merely rise more slowly than a microbubble; it does not rise at all. It does not merely transfer slightly more gas; it creates a persistent dissolved gas reservoir. It does not merely have a slightly higher surface area; it can adsorb contaminants, generate free radicals, and modify liquid chemistry in ways that are simply not available from any larger bubble technology.
The practical implication is that nanobubble technology is not a drop-in upgrade to existing aeration or gas-dissolution systems. It changes what is possible in the process. Understanding this distinction — clearly, technically, and without marketing inflation — is what enables engineers and application developers to deploy the technology where it genuinely transforms outcomes, and to avoid over-specifying it where simpler technologies will do.
TMC Fluid Systems and TMC Nanobubble Systems are committed to that standard: validated, independently tested performance data; transparent sizing guidance; and application expertise rooted in real-world installations across aquaculture, wastewater, agriculture, carbon capture, and industrial process water.
